Optimizing Decarboxylation
This article was first published as an “Application Note” on PerkinElmer’s website in 2018.
The production of cannabis extracts and oils for medicinal and recreational products has increased significantly in North America. This growth has been driven by both market demand in newly legalized states and patient demand for a greater diversity in cannabis products.[1,2,3] Most cannabis extraction processes, independent of solvent or instrument choice, undergo a decarboxylation step whereby the carboxylic acid functional group is removed from the cannabinoids. The decarboxylation reaction converts the naturally occurring acid forms of the cannabinoids, e.g. tetrahydrocannabinolic acid (THCA) and cannabidiolic acid (CBDA), to their more potent neutral forms, e.g. tetrahydrocannabinol (THC) and cannabidiol (CBD). Because the carboxylic acid group is thermally labile, the industry typically applies a heat source, and at times a catalyst, to decarboxylate the cannabinoids.
The heat-promoted decarboxylation reaction has been discussed at length within the industry, but an extensive literature search reveals very few papers on the process.[4, 5, 6] The data available represents a large spectrum of reaction conditions, including a range in reaction temperature, time and instrumental setup. As such, there is a lack of universal agreement surrounding the optimal reaction conditions for the decarboxylation process in cannabis extract. This reaction is further complicated by its sensitivity to water, with increased water content promoting the reaction.[7] Additionally, studies show that competing isomerization, oxidation, and decomposition reactions can occur at elevated temperatures.[7] These factors can lead to inconsistent cannabis extract products and an overall lack of quality control in the laboratory.
Cannabis quality control laboratory technicians and extraction manufacturing staff have difficulty predicting the optimal reaction time and temperature to attain maximum decarboxylation. Current manufacturing practices typically involve placing the cannabis extract on aluminum sheet trays in a vacuum oven or in a glass beaker on a stirred hot plate. The conditions required for these techniques to reach reaction completion is largely undefined and decarboxylation is rarely monitored during the heating process. When decarboxylation is monitored, extractors rely on physical observations such as a reduction in carbon dioxide off-gassing.
The lack of chemical information during this critical processing step leads to a highly subjective determination of reaction completeness. This results in extraction processes that lack scientific robustness and are far less efficient at achieving decarboxylation. Furthermore, the lengthy reaction times coupled with the uncertainty in optimum temperature can result in an inefficient use of laboratory resources and overall lack of process control. To this end, we investigated the use of Fourier transform infrared spectroscopy (FT-IR) with Attenuated Total Reflectance (ATR) to provide a quantitative estimation of the decarboxylation reaction progress in cannabis extract.
Experimental
Cannabis plant matter was milled to a 2 mm particle size (Fritsch P19, Germany). Cannabis extracts were produced by carbon dioxide supercritical extraction in a 20L, 2000 psi system (Apeks Supercritical®, USA). The cannabis extracts differed in THCA and THC concentrations. Also, different cannabis oil amounts were tested.
Decarboxylation
Decarboxylation was achieved by heating the cannabis extract in a oil bath with a programmable hot plate. An overhead stirrer was utilized to promote even heat distribution throughout the experiment. Oil bath and extract temperatures were recorded every five minutes throughout the 80-minute heating process. Mid-infrared spectra were collected every five minutes by pipetting a small amount of the heated extract onto the crystal of a PerkinElmer Universal Attenuated Total Reflectance (UATR) accessory. Aliquots at varying time points throughout the experiment were collected and submitted for cannabinoid concentration determination using high performance liquid chromatography (HPLC).
Infrared spectra were acquired using the PerkinElmer Spectrum Two™ equipped with a UATR accessory. Spectra were collected over the 4,000 – 450 cm-1 spectral range having 4 cm-1 resolution with each spectrum being the result of four averaged spectra.Sample spectra and corresponding reference HPLC cannabinoid concentrations were imported into PerkinElmer Spectrum Quant™ software for the development of quantitative chemometric models. Spectral pre-processing was performed to include the 3,665 – 2,775 cm-1 and 1,755 – 450 cm-1 regions with absorbance threshold blanking at values greater than 1.5 absorbance units. The regions excluded from the model development are of very little chemical significance. Principal Component Regression (PCR) was used to generate quantitative models for THCA and THC. Leave-one-out cross-validation was performed during the calibration step. A total of 29 calibration spectra were used to build models for predicting concentrations of THCA and THC in the cannabis extract.
Results and Discussion
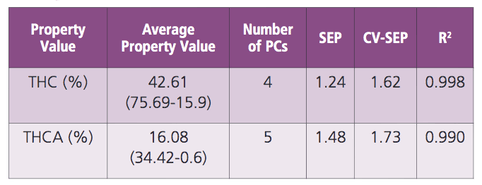
Changes in the infrared spectra indicate a loss of water and the conversion of THCA to THC as the reaction progresses. The PCR models were individually optimized for each cannabinoid, THCA and THC. Table 2 highlights the regression details for the final regression models. The coefficient of determination, R2, values of 0.990 and 0.998 for THCA and THC, respectively, indicate excellent correlation between reference HPLC cannabinoid concentrations and those predicted by FT-IR. Correlation plots for calibration data points are shown for both THCA and THC models in Figure 2. As shown in the correlation plots, calibration data points are evenly distributed throughout the entire calibration range for each cannabinoid.
Decarboxylation Reaction Monitoring
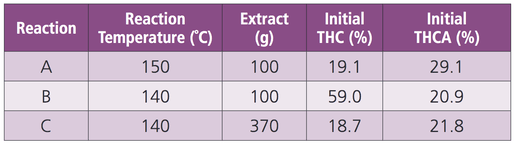
Three separate decarboxylation reactions were performed with oil bath temperatures ranging from 140 – 150 ̊C. Starting THCA and THC concentrations ranged from 20.9 – 29.0% and 18.7 – 59.0%, respectively.
As the decarboxylation reaction progresses, THCA is converted to THC. This trend is illustrated in Figure 3 which plots the cannabinoid concentrations throughout the reaction. Cannabinoid concentrations predicted by FT-IR-ATR are overlaid with the HPLC reference values. The excellent agreement between the two techniques highlights the ability of FT-IR-ATR to accurately monitor the decarboxylation reaction in real time.
Conclusion
The PerkinElmer Spectrum Two with the UATR accessory allows for the simple and rapid determination of cannabinoid concentrations in cannabis extract. The FT-IR-ATR technique offers a real-time solution to decarboxylation reaction monitoring. The ability to monitor this reaction over time would enable manufacturers of cannabis extract to optimize extraction conditions and identify process deviations. The FT-IR-ATR technique requires small sample quantities, zero sample preparation and minimal operator training.
References:
1. Weed, Julie. “Cannabis Industry Delivers 100,000 + Jobs and Billions in Tax Revenue.” Forbes, 22 May 2018, https://www.forbes.com/sites/julieweed/ 2018/05/22/cannabis-industry-delivers-100000-jobs-and-billions-in-tax-revenue/#3d3068b72879.
2. “State Marijuana Laws in 2018 Map.” Governing, http://www.governing.com/gov-data/state-marijuana-laws-map-medical-recreational.html.
3. Lindsey, Nick. “Data Shows The Demand for Legal Cannabis Is Increasing.” HighTimes. 13 April 2018, https://hightimes.com/news/data-shows-demand-legal-cannabis-increasing/.
4. Ardent Cannabis. “What Is Decarboxylation, and Why Does Your Cannabis Need It?.” Leafly, 30 April 2018, https://www.leafly.com/news/cannabis-101/what-is-decarboxylation.
5. Cannabis Extracts. “Catalyst for THCa decarboxylation?” reddit.https://www.reddit.com/r/CannabisExtracts/comments/6ven87/catalyst_for_thca_decarboxylation/.
6. DOI: 10.1089/can.2016.0020 B) Journal of Chromatography 520 (1990) 339-347
7. Roggen, Markus. “Latest Advances in Cannabis Production Processes.” https://www.slideshare.net/MarkusRoggen/presentations.